top of page

Unpacking the migrant economy

What can migrants’ earnings buy? In Odisha, migrant workers are bringing in as much or more financial resources as the government spends on development activity in some blocks. The income from migration has pulled families out of debt and poverty in several villages, research shows


Liby Johnson


Bustling market area in Surada block. Photo credit: Rufus Sunny, Gram Vikas


“I think there is something seriously wrong with the household survey in Surada. The numbers that are coming out seem to be very unrealistic”, Benoy Peter tells over a telephone call one afternoon. “How can more than 70% of the households have a migrant?”


Gram Vikas, the organisation I work with, and Centre for Migration and Inclusive Development (CMID), the organisation that Benoy leads, have been working together for more than five years to understand issues of labour migration from Odisha.


Migration from Odisha is not a new phenomenon. The popular imagination of migration in the state is influenced by the large number of families that travel by trains from the western districts of Bolangir and Nuapada to work in the brick kilns in Andhra Pradesh/ Telangana or as informal sector workers in the urban centres in Chhattisgarh. This form of migration is driven by distress, with the households forced to take advances from labour contractors to raise the rainfed crop in the monsoon season. In return, they are forced to engage in backbreaking labour, in abysmal living conditions, and suffering from various forms of abuse and discrimination. Popular media in Odisha often reports on the villages where every able-bodied man, woman and child have migrated, leaving behind only the old and the very young. This cycle of migration continues every year, with the exodus beginning in November and returning in June.


Odisha has also had migration of other forms. Cooks, plumbers and electricians from Odisha, particularly the coastal districts around Cuttack are a regular feature in many Indian cities. The power loom textile industry in Surat in Gujarat employs an estimated 7 lakh people, most of them from Ganjam district. In fact, nearly one-third of the migrant workers in Surada and Jagannathprasad work in Surat. In all these cases, it is almost entirely the men who originally migrated, with the families staying behind. A small proportion of them have moved permanently with families to their work locations.


Two percent of the total households had women or girls who had migrated out of the Ganjam district for work. Picture credit: Ajaya Behera, Gram Vikas


Migration to destinations in southern India, from the southern districts of Odisha – Gajapati, Ganjam, Kalahandi, Kandhamal, and Rayagada is a more recent phenomenon. This too is largely male migration – the proportion of women among migrant workers range from 1.2% in Thuamul Rampur to 10.6% in Baliguda.


Both Gram Vikas and CMID have together been carrying out ‘Block Migration Profiles’ - a scientific, rigorous sample survey - that provides information about the socio-economic context of the block. A block is a cluster of villages, and we have been studying, mapping the incidence and nature of migration from different blocks in Odisha, the perceptions of migrant workers and their households on the benefits and challenges that migration poses. 


During 2020 to 2022, Gram Vikas and CMID prepared block level migration profiles of four blocks in four districts of Odisha - Rayagada block in Gajapati district, Jagannathprasad block in Ganjam district, Baliguda block in Kandhamal district and Thuamul Rampur block in Kalahandi district. We conducted the survey in Surada block in Ganjam district in 2023.


Our findings in the blocks revealed that people opted for migration as a livelihood choice. It is necessary for the rest of us, in policy making and practice, to understand migration for work as an intermediate livelihood option, a tool in fact aiding the transition from a subsistence oriented agrarian economy and society to one with diversified livelihoods options.


The block profiles provide information on how this could be happening.


Through remittances.


FOLLOW THE MONEY


 Four out of five agricultural households in Surada reported negative climate impacts on profitable farming practices. Picture credit: Ajaya Behera, Gram Vikas


What began as a casual port of call during the 2018 floods in Kerala has today developed into a full-fledged partnership between Gram Vikas and CMID that together run the ‘Safe and Dignified Migration' programme in the Odisha-Kerala corridor. 


Our approach to enabling safe and dignified migration has four key components: scientifically designed studies to understand the nature of migration; a corridor approach to enabling safe and dignified migration through collaboration with governments and other stakeholders; destination level services to migrant workers; and source level activities focussing on financial and emotional well-being of families of migrants who stay back.


We found that Rayagada and Baliguda blocks each received ₹ 1.8 crore per month as remittance in 2020. In Thuamul Rampur block, the remittance was about ₹ 2.3 crore a month, or ₹ 28 crore in a year. We were very surprised by these numbers, but there were more surprises in store, with the other blocks.


At this point, we reviewed the government spending on development activities in Thuamul Rampur block to understand the remittance better and found that in the five years between 2015 and 2020, an amount of  ₹ 30 crore had been spent each year. Which means that migrant workers in this block are bringing in as much or more financial resources as the government. What is remarkable is that the remittance from migrant workers is completely new money for the district.


Our remittance findings were far from over. We were yet to uncover bigger money inflows.


In Jagannathprasad block, remittances estimated in 2020 was ₹ 64 crore per annum. 


Surada block received an estimated ₹ 180 crore in 2023. In per capita terms, this means ₹ 12,587 for every resident of Surada block. The per capita income of Odisha for 2023-24, as per the Economic Survey of the Government of Odisha, is ₹ 1,61,437. Based on my understanding of the context of Surada block, I would assume that the per capita income there would be about 75% of the figure for Odisha, or ₹ 1.21 lakh.


Remittances thus account for 10% of the per capita income of the block.


Bustling market areas in Surada block. Photo credit: Rufus Sunny, Gram Vikas


These numbers are logical estimations based on certain indicators. The migration profiles also have evidence of the impact of migration on the households through a set of perception-based questions.


Proportion of households with a history of migration which report that they would not have been able to come out of poverty without the income from their migrant household members range from 62.9% in Baliguda to 95.8% in Surada.


Proportion of households reporting that they would not have been able to repay debt without the income from the migrant members of the household range from 33.3% in Baliguda to 79.2% in Surada.


Proportion of households reporting that their savings have increased due to income from the migrant members of the household range from 46.4% in Baliguda to 70.3% in Surada.


About 12% of the households in Rayagada and Baliguda blocks, 15% in Jagannathprasad, 27% in Thuamul Rampur, and 35% of households in Surada report their ability to diversify household income sources as a result of migration. Similar sentiments are echoed in case of improvements being made to agriculture.


Migration income has helped households to improve their physical quality of life, starting with a better house: 5% of households in Thuamul Rampur, 9% in Baliguda, 26% in Surada, 28% in Jagannathprasad, and 32% of households in Rayagada have reported use of income from migration to build a new house.


THE MIND-BOGGLING SCALE OF MIGRATION


Historical incidence of migration reported in the four blocks where we did the study in 2020-21, ranged from 36% in Baliguda to 61% in Jagannathprasad (refer to the table above).


The incidence of migration outside the district at the time of the survey, ranged from 19.8% in Thuamul Rampur to 37.8% in Jagannathprasad.


The numbers that emerge from Surada have challenged our sense of the scale of migration.


Nearly 80% households in Surada block has had a migrant worker in the last 10 years (see table above). When seen disaggregated by social categories, 81.6% of households belonging to Other Backward Castes have experienced migration.


The numbers for current migration are equally huge.


Surada’s migration incidence is twice that of Jagannathprasad block, also in Ganjam district and located about 50 kms to the north-east. These two blocks are quite similar in many ways. The total population of Surada is 1.43 lakh, while that of Jagannathprasad is 1.31 lakh. In terms of land area, Surada is about 42% larger than Jagannathprasad. 


The distribution of population among social categories is also quite similar, in the two blocks, Scheduled Communities form about one-thirds of the population. Jagannathprasad has a higher proportion of general castes than Surada.

Social Category

Surada

Jagannathprasad

Scheduled Tribes

16.0%

3.6%

Scheduled Castes

19.3%

29.9%

Other Backward Castes

61.7%

56.8%

Others

3.0%

9.7%

The demographic profile in the other three blocks where we prepared migration profiles was very different. Rayagada in Gajapati has nearly 80% population belonging to Scheduled Tribes, Baliguda has about 64%, and Thuamul Rampur has 87% of their population belonging to SC-ST communities. 


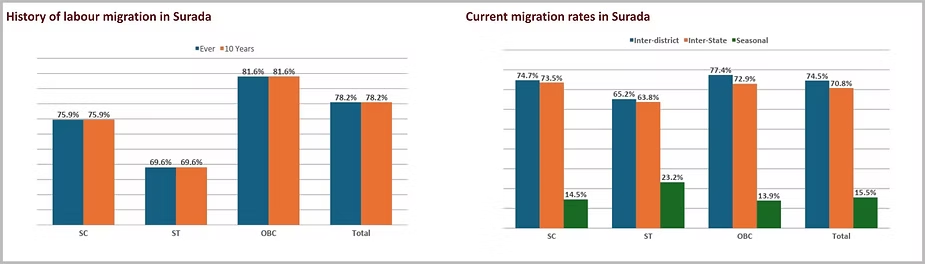
The migration numbers from Surada had us flummoxed. So, Benoy visited Surada in early 2024 to re-verify the survey numbers. He visited several villages and interacted with the residents. We checked the house listing data  and also reconfirmed the survey responses on a random basis. 


Everything pointed to the numbers being correct. 


What accounts for the high incidence of migration in Surada? 


It is worthwhile to look at some key parameters of the two blocks of Surada and Jagannathprasad to understand this better. 

Parameter

Surada

Jagannathprasad

Median size of household

5

4

% of households with more than 5 members

52%

37%

Median years of education of the population as a whole

9

10

Median years of education of migrant workers

5

8

% of population with education below Class 10

36.40%

38.70%

% of migrant workers with education below Class 10

79%

47.6%

Median income from usual residents (₹)

1,500

5,000

Median income from all sources (₹)

16,500

8,500

% of households with an electricity connection

93.30%

95.20%

% of households with a smartphone

48%

47.30%

% of landless households

44.10%

40.60%

% of households owning livestock

41.60%

65.80%

Three parameters in the above table have implications on the migration incidence in Surada - the higher proportion of larger households, the lower income earned by usual residents, and the lower proportion of households owning livestock. These three point to a greater sense of insecurity among the people that could be leading to higher migration for work. A fourth, the significantly lower educational level of migrant workers is also noteworthy; one will need to look at the age profiles of migrant workers to understand this better.


The block profiles are not designed to be used to make causative connections. One can only make an educated guess, based on a broader understanding of the larger context of the area. The fact remains that we need to improve our understanding of what drives labour migration from these parts of Odisha.


DESTINATION KERALA


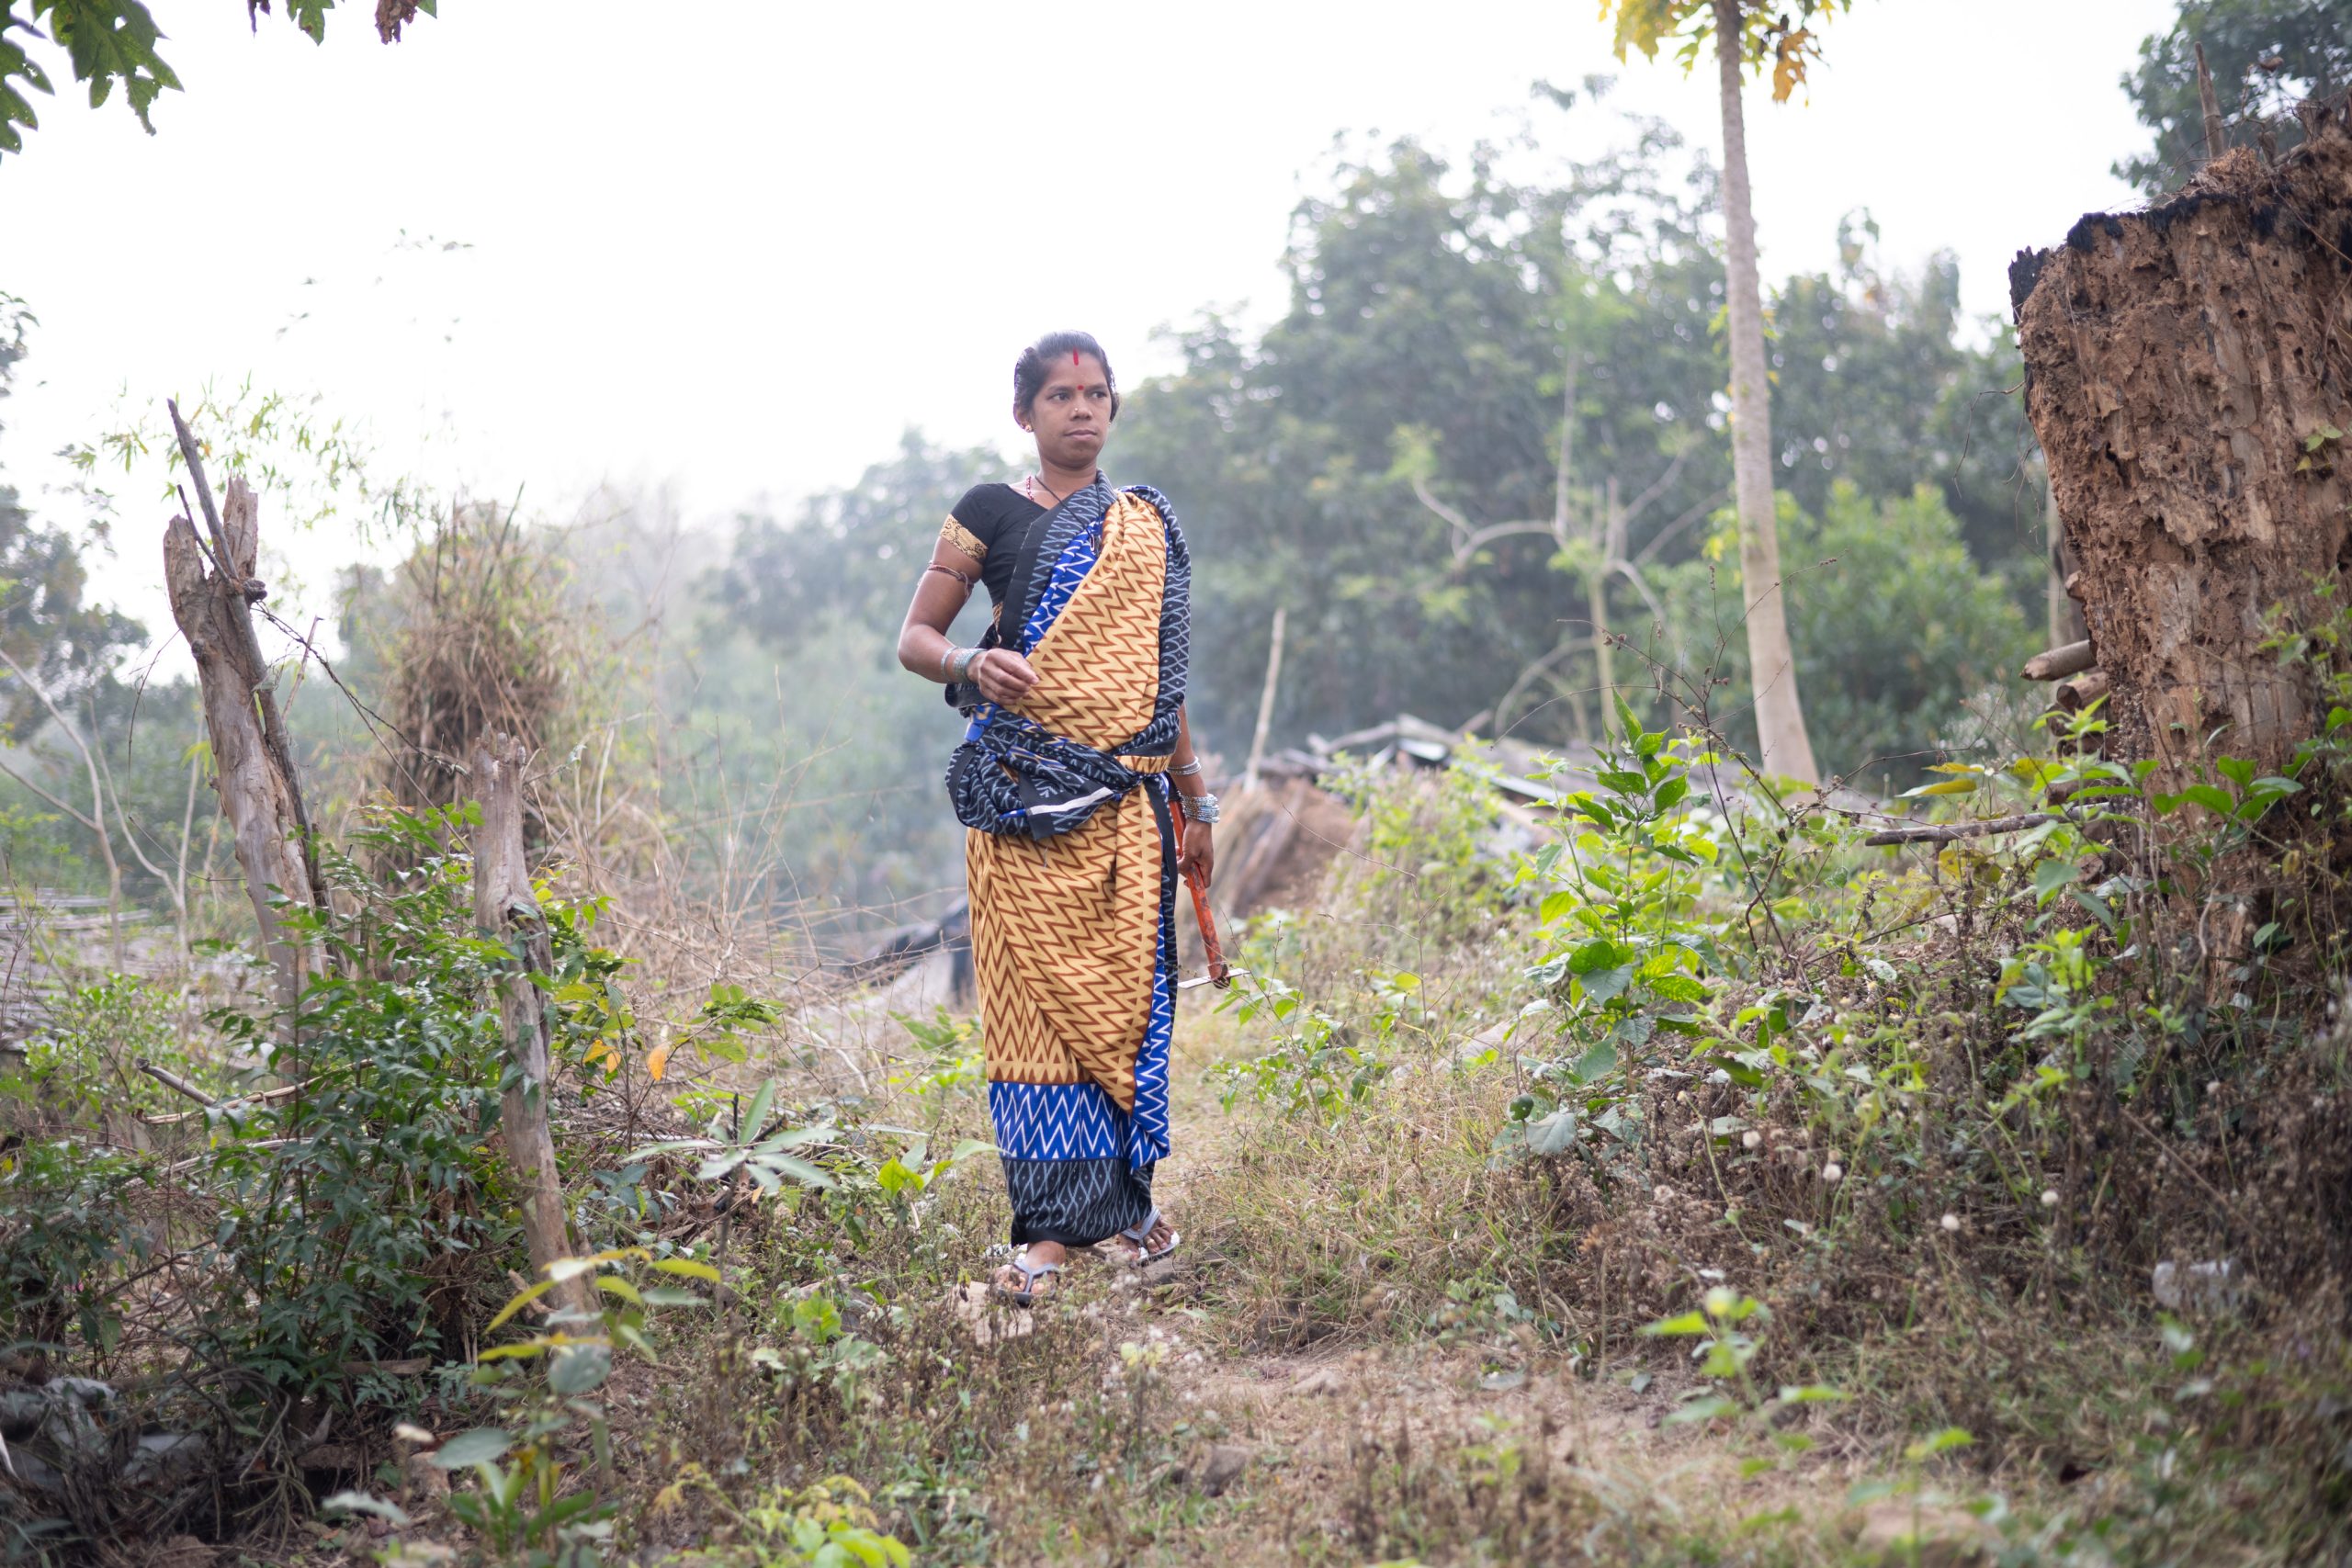
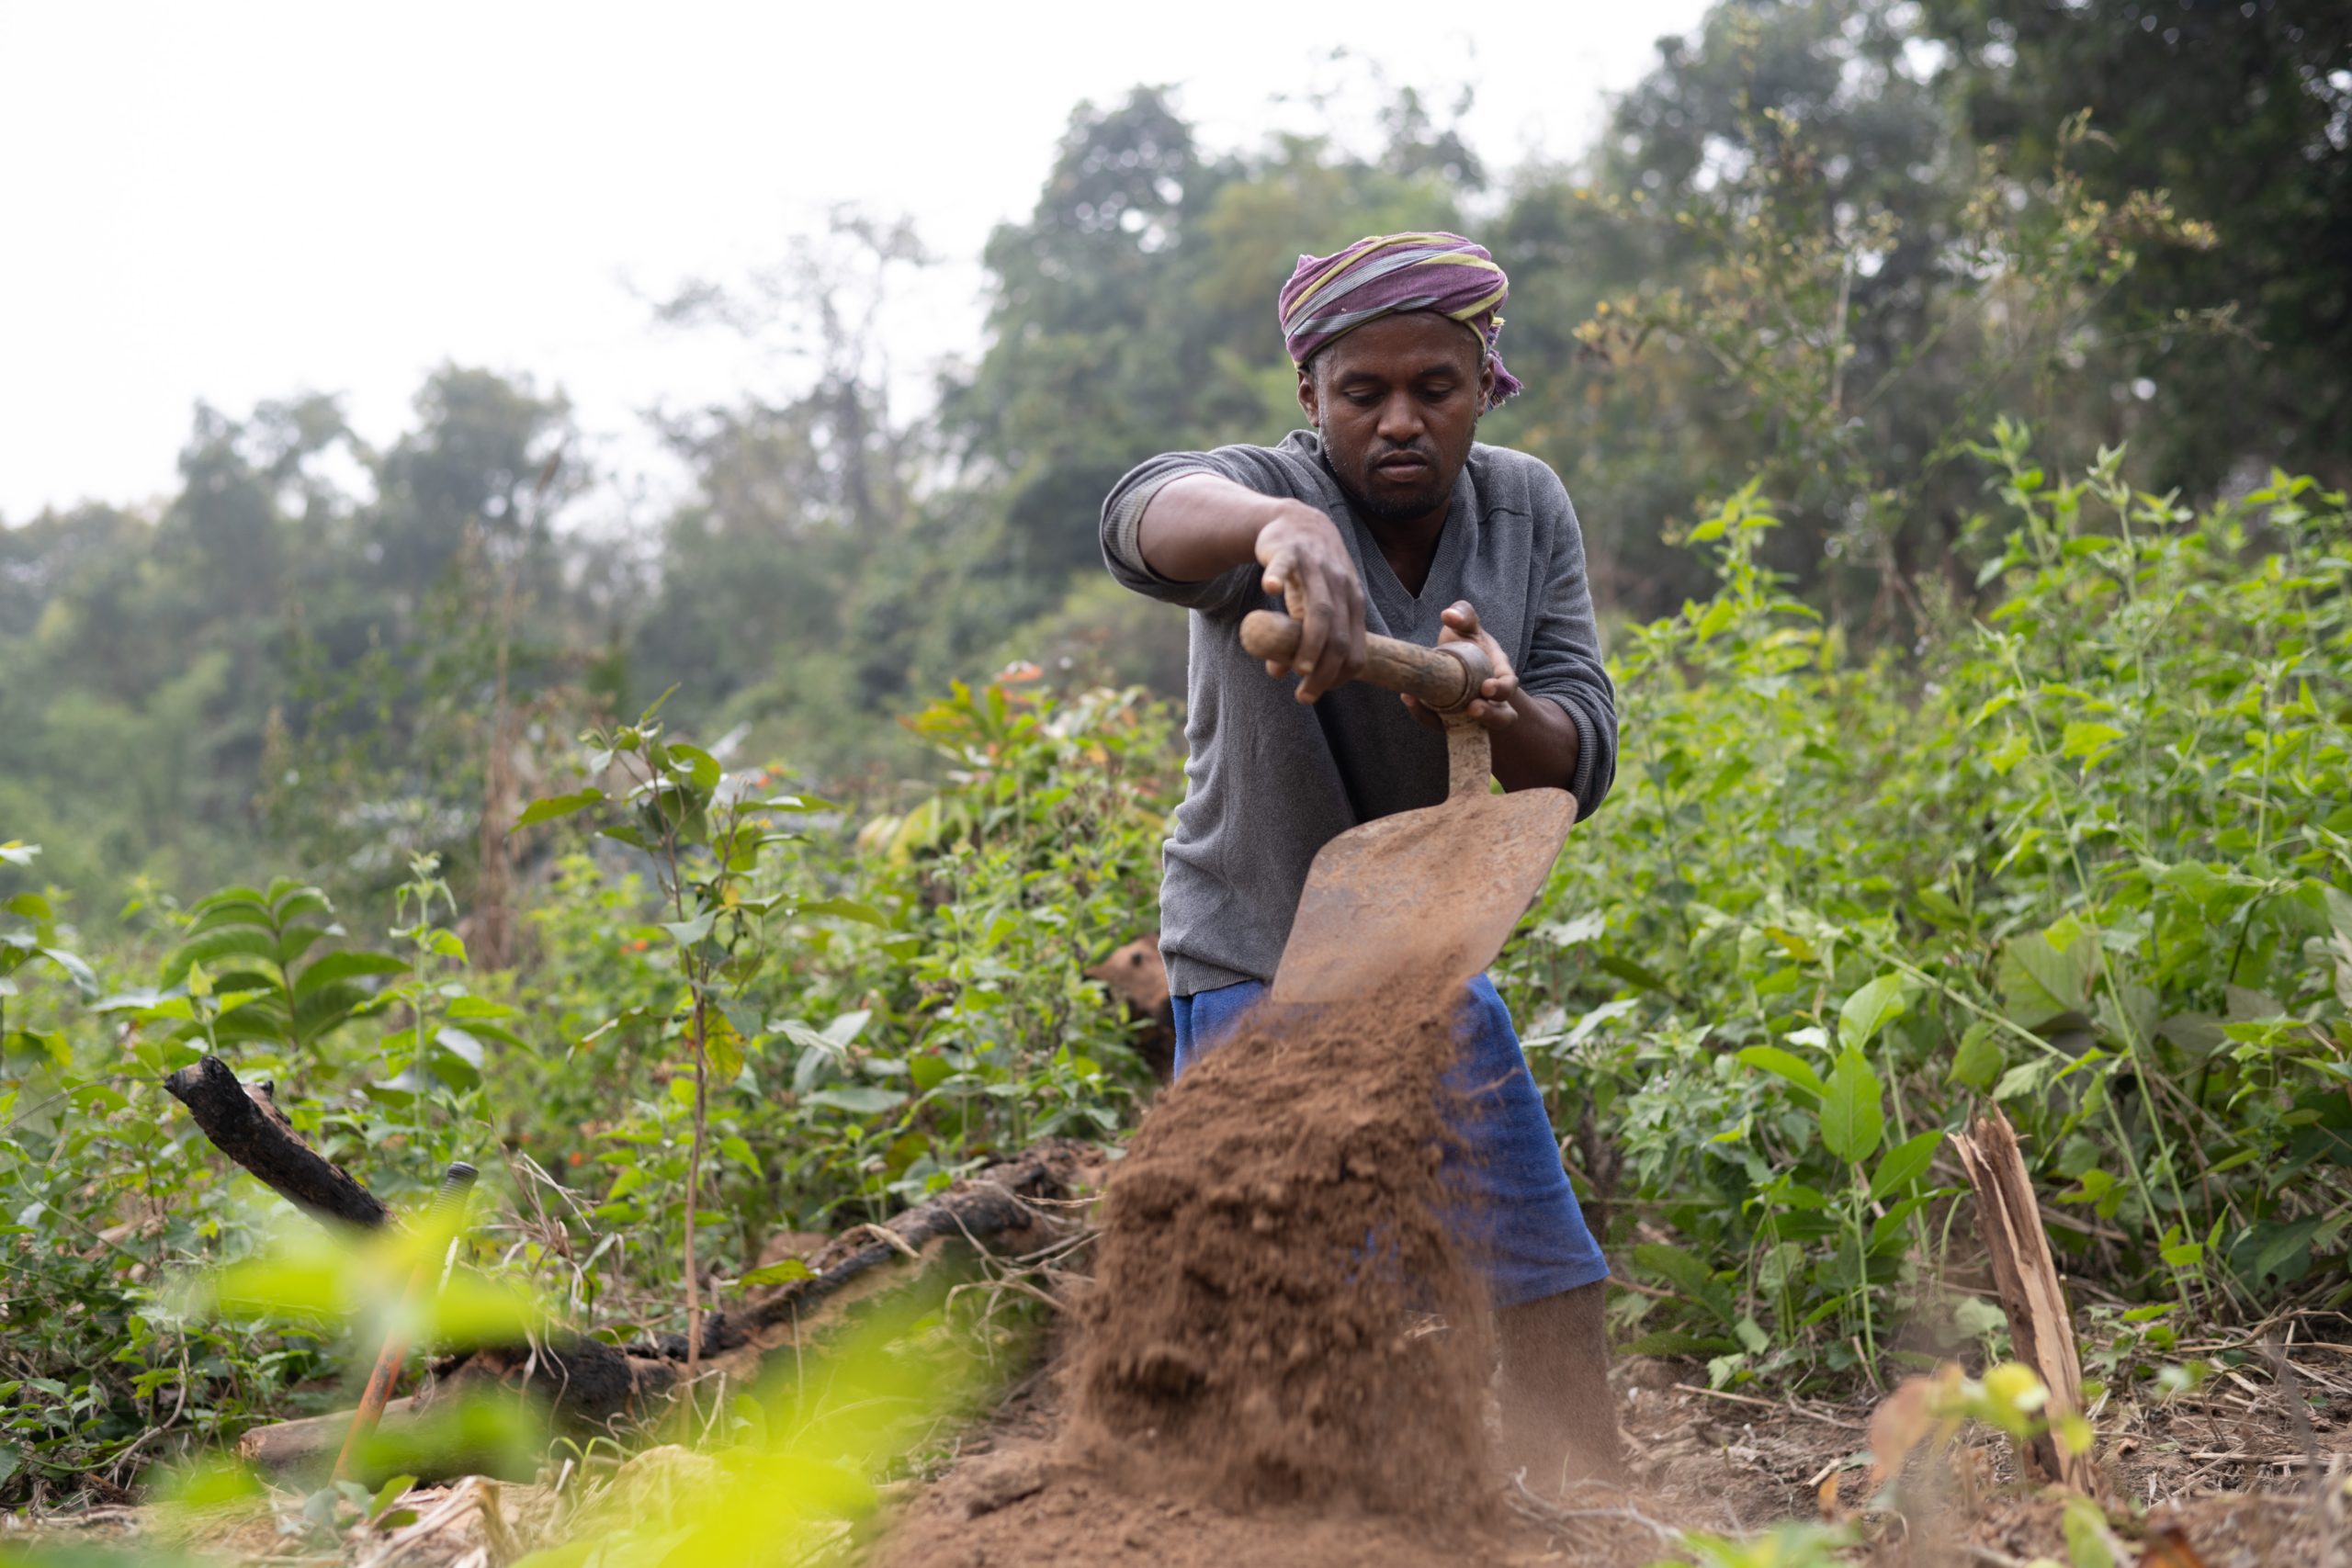
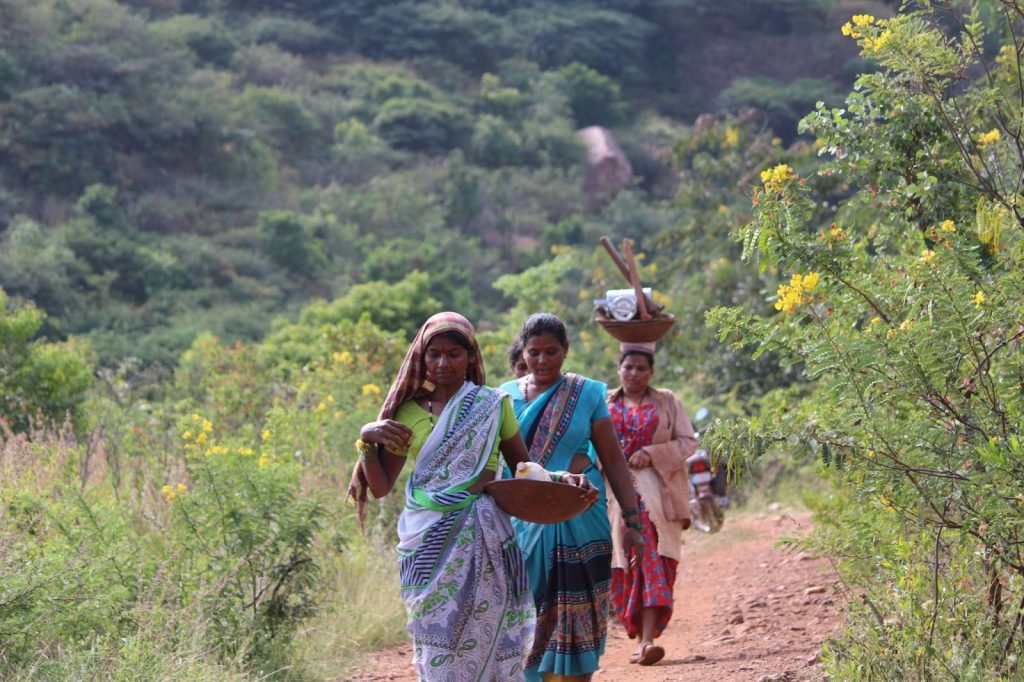
The opportunities for secure and sustainable livelihoods in the villages of Odisha are limited by a variety of resource constraints. The North-Eastern Ghats and Western Undulating Lands agro-climatic zone regions, the area where most of Gram Vikas’ work is focused, are characterised by a mixture of moist peninsular, tropical-moist, dry-deciduous and tropical-deciduous forests and rain-fed agricultural economy. The high dependence on scarce and low-quality land and dwindling forest resources cannot sustain a dignified quality of life. Industrial activity in the region is largely in mining and provides little in terms of employment opportunities, while adversely impacting the natural environment. At the same time, improved access to education and exposure to new technologies are changing the aspirations of the younger generation.


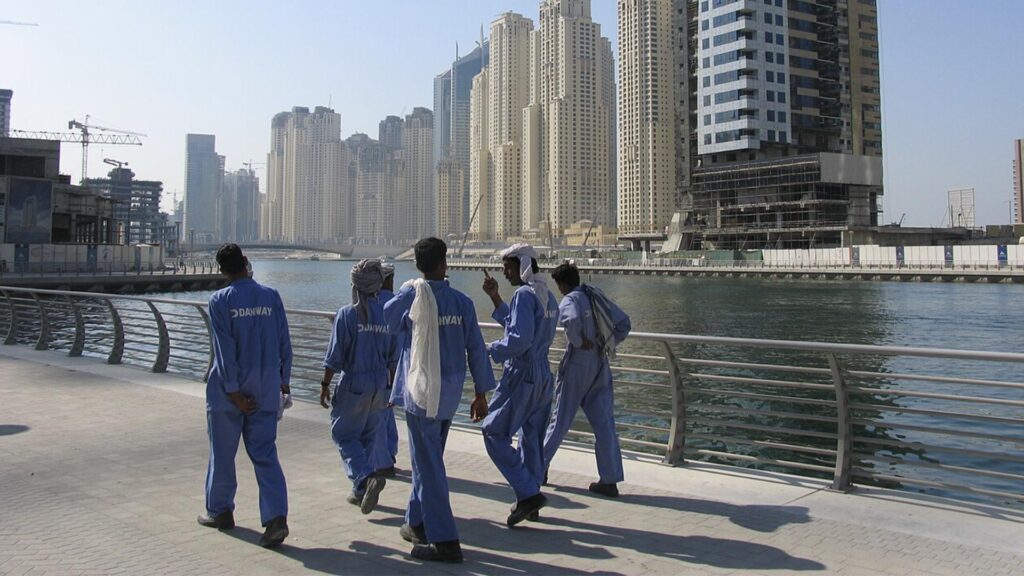
What are the factors that make southern Indian destinations, particularly Kerala, more preferred?


Kerala pays, arguably, the highest wages for unskilled work in all of South Asia. A new migrant worker can reasonably expect to get ₹ 750 to ₹ 800 as daily wages for unskilled work in a construction site in the State. For those in the services sector such as restaurants and hotels, regular monthly wages range upwards from ₹ 10,000 with food and accommodation coming free. At home they would get ₹ 250 to ₹ 400, with work available for 150-200 days in the year. In the destinations, they can work every day, even work overtime.


Kerala and the urban centres in south India also provide workers from traditionally disadvantaged social groups a great escape into an identity-neutral ‘paradise’. In Kerala, for example, every worker from eastern India is a “Bengali”, irrespective of caste or religion. Many young people have reported this to be a deciding factor for the choice of destination. Given the social networking mode of migration decision making, it is only a matter of time before a larger number of people flock to the destination.


It would be interesting to imagine what the landscape of Surada and other blocks would look like had migration not been an option for this population. It is a thought exercise fraught with many difficulties, as one would not be able to navigate the negativity of the emerging situation. Hence, it is best left not done.


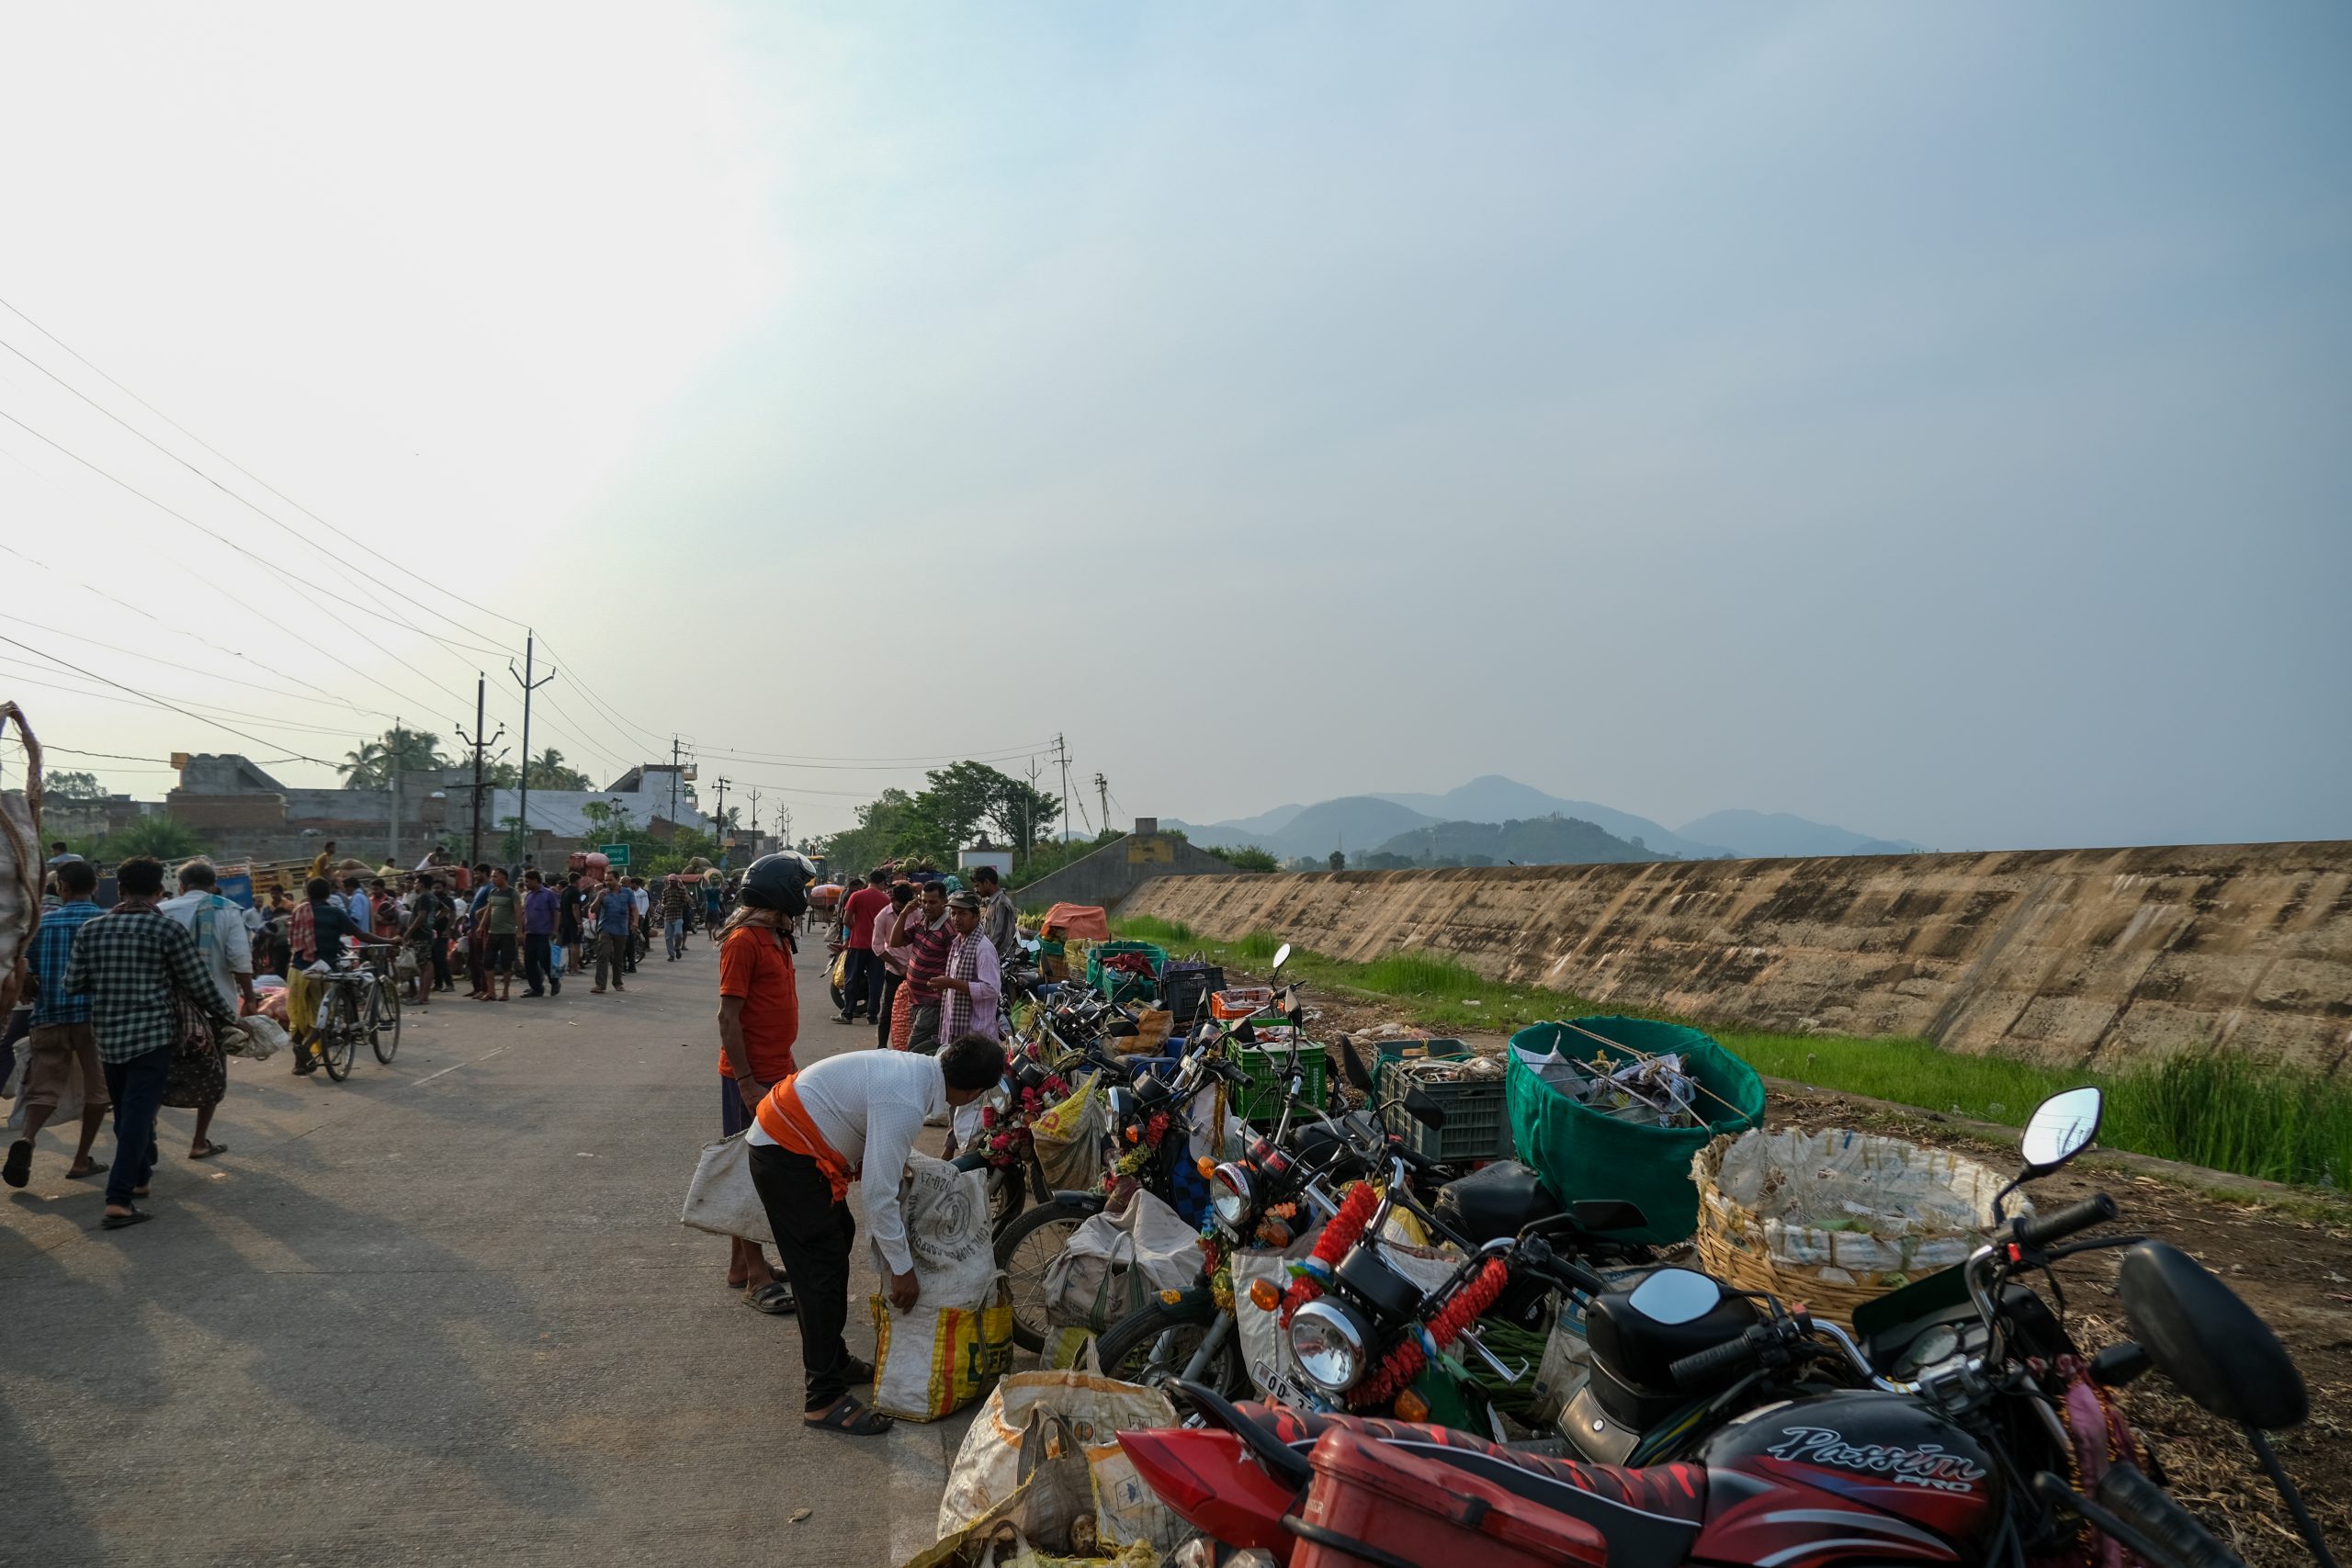
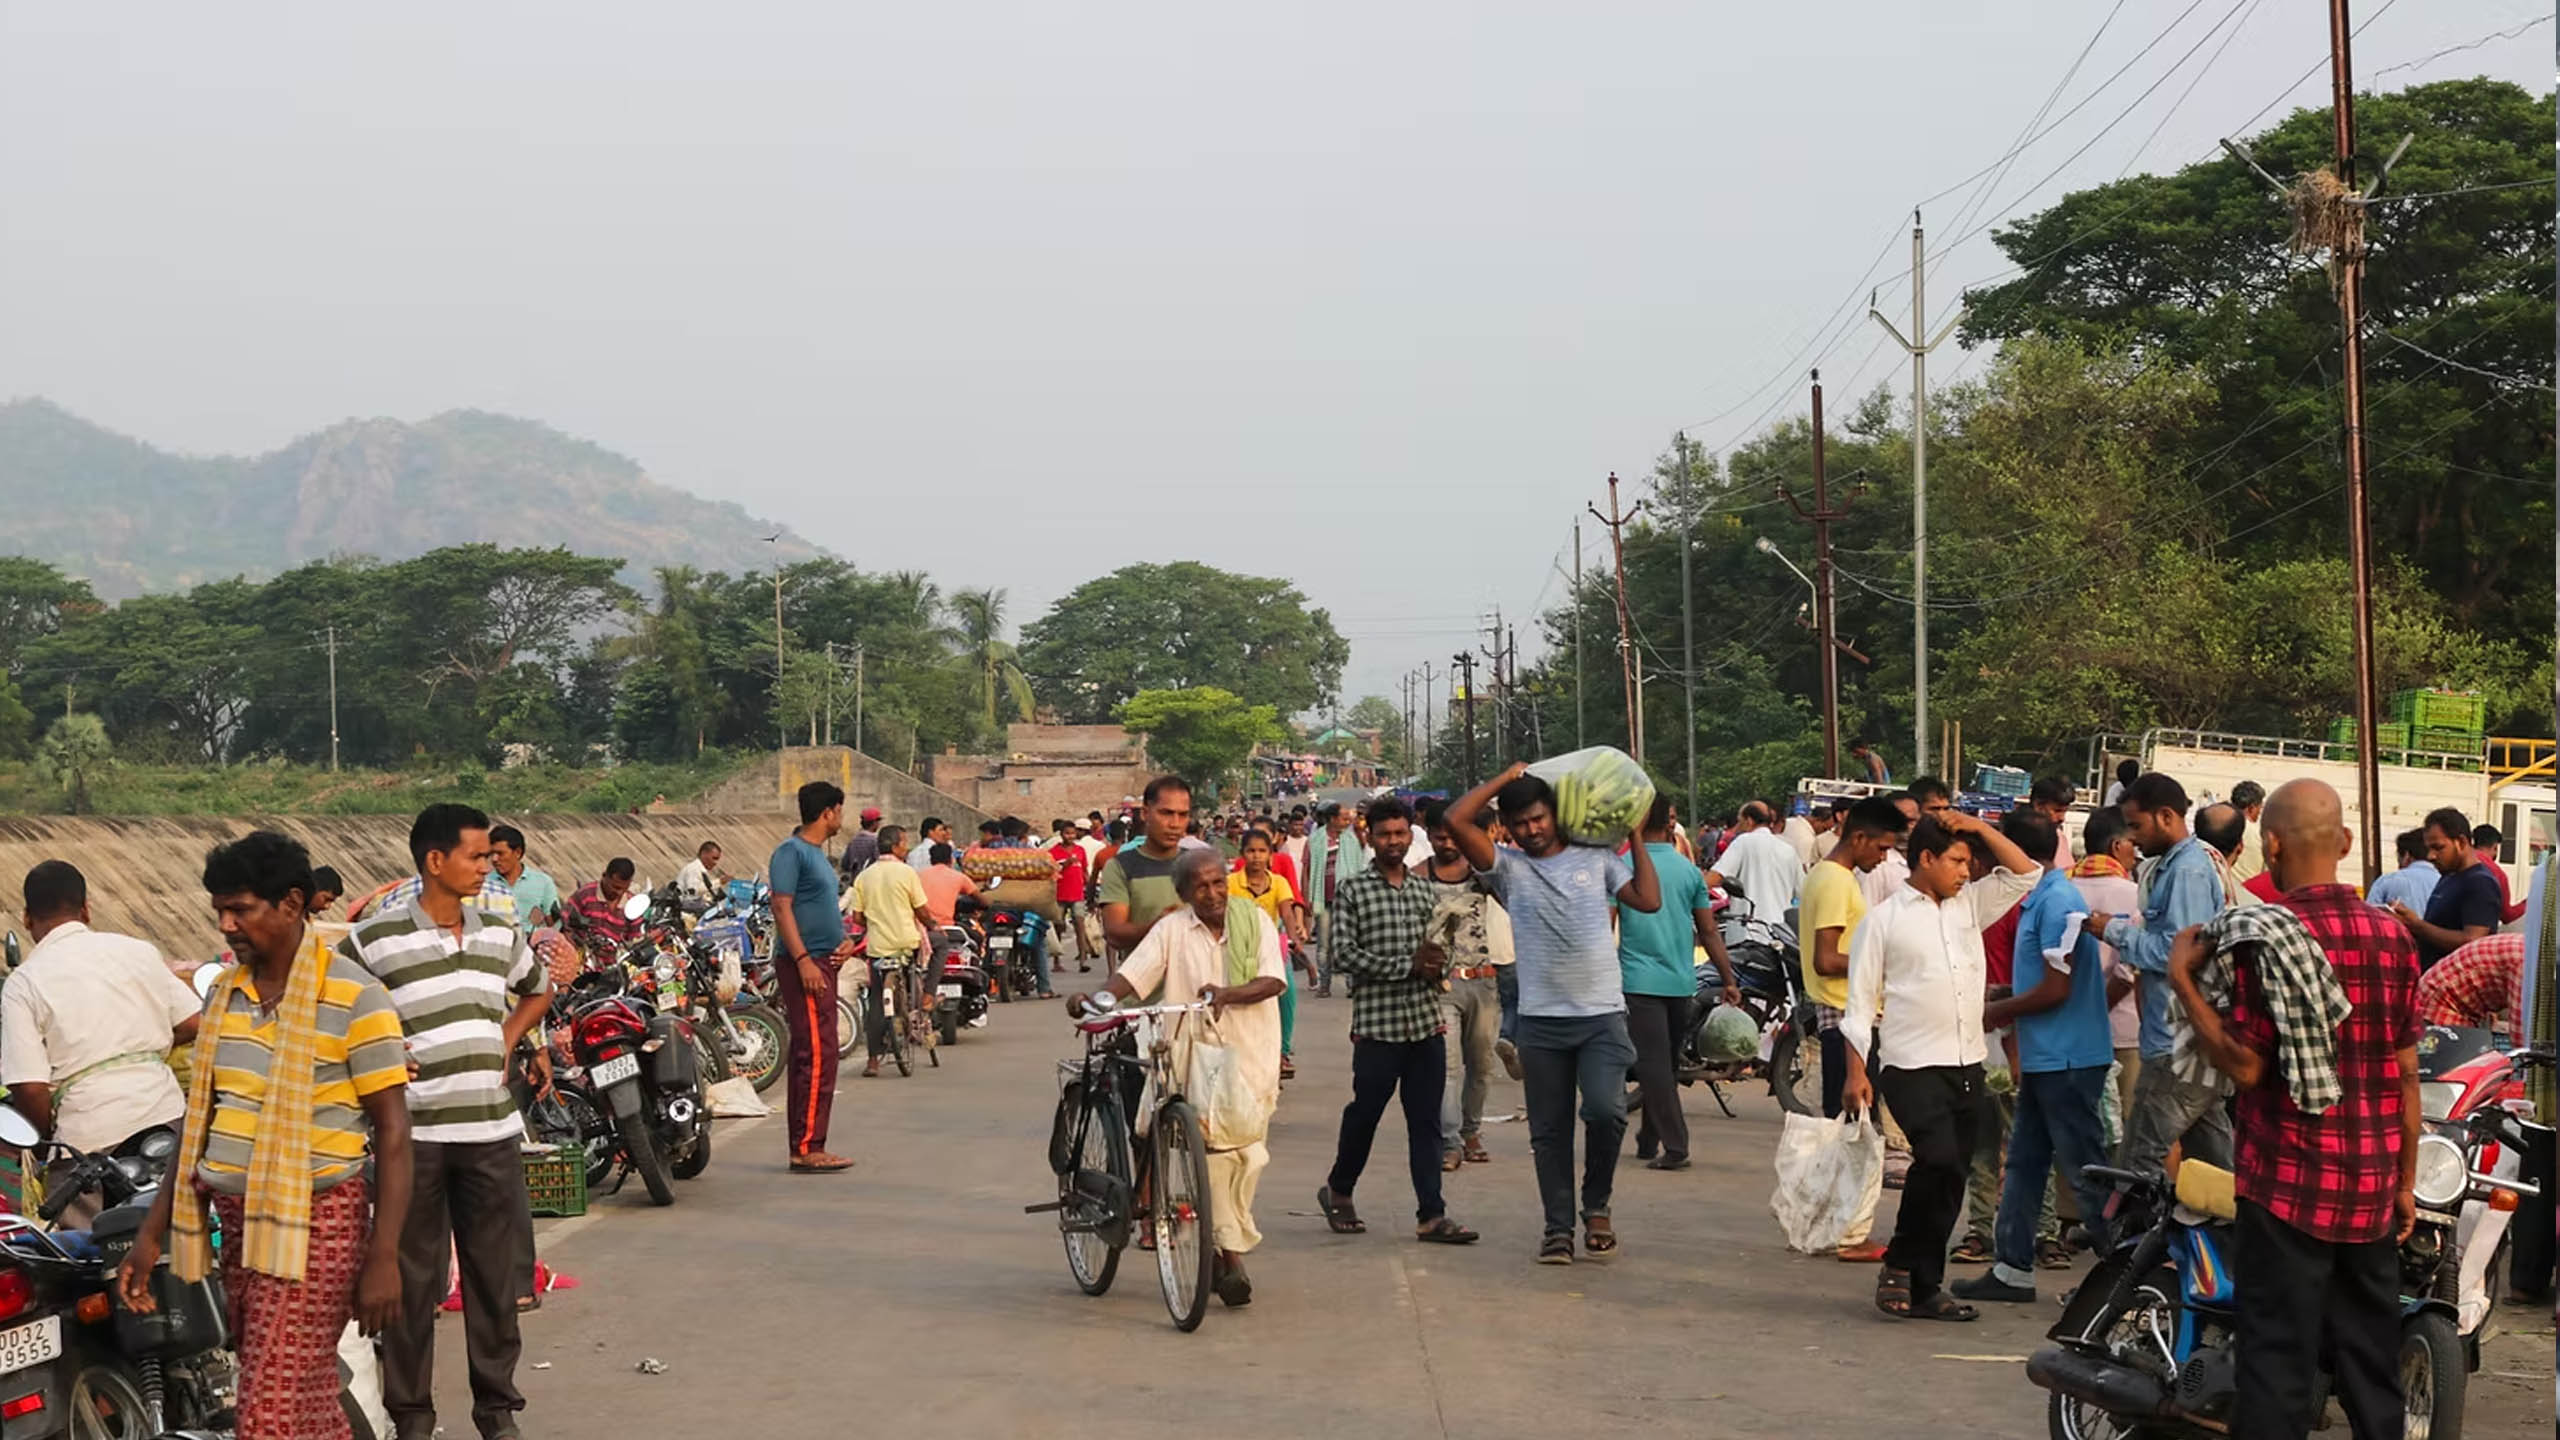
What remains is the reality that more young people are taking trains from Muniguda, Rayagada or Brahmapur railway stations to Chennai, Bengaluru, Thrissur, Aluva or Ernakulam. More bank accounts are being opened, banking correspondents in the source villages are finding increasing business, remittance incomes are increasingly being invested in productive assets and businesses, and there is a general fillip to education of girls in the villages. At the same time, more workers and family members are reporting about the emotional stress from being separated for long periods of time, older household members are complaining of neglect as there is no one to bring them medicines or collect fuelwood from the forests, and many more households are giving up on agriculture as an occupation.


Let me end with an experience that Benoy reported during his visit to Surada to verify the survey numbers. In Asurabandha village he walked into a banking correspondent kiosk, done up almost like a regular bank branch, doing transactions between ₹ 6 to 8 lakhs every day. All of it migrant remittances.


Liby T Johnson is the Executive Director of non-profit Gram Vikas, Odisha. He has led large-scale, impactful efforts over nearly three decades in the community development sector in India with civil society and governments.


Comentarios


All Hands In

Support The Migration Story- become a member!

bottom of page